The Western Cape (WC), one of South Africa’s nine provinces, plays a pivotal role in the nation’s economy, contributing significantly to the national treasury while managing a robust provincial budget. In the 2024/25 fiscal year, the WC’s fiscal dynamics can be encapsulated in a carefully constructed income and expenditure balance sheet, reflecting its tax contributions, provincial spending, national functions within its borders, and transfers to other provinces. This article unpacks the current financial structure, drawing on data from the South African National Treasury, the Western Cape Government, and other sources, to provide a clear picture of how funds flow in and out of the province.
The Western Cape’s Income: A Tax Powerhouse
The WC is estimated to contribute approximately R300 billion annually to South Africa’s national fiscus, representing roughly 13% of the country’s total revenue of R2.3 trillion, as outlined in the 2024 Budget Speech. This figure is derived from the province’s economic weight, contributing 14% of national GDP (approximately R977 billion of South Africa’s R7.1 trillion nominal GDP in 2024, per Stats SA estimates). The WC’s tax revenue includes personal income tax (R92.1 billion), VAT (R70.9 billion), corporate income tax (R46.5 billion), customs and excise (R20.9 billion), and other levies (R89.1 billion), calculated based on its proportional economic activity and consumption patterns.
From this R300 billion contribution, the WC receives R84 billion for its provincial budget, comprising R80 billion from the National Treasury (via the Provincial Equitable Share and conditional grants) and R4 billion from provincial own revenue (e.g., motor vehicle licenses, casino taxes). This means that only 25% from the tax contribution is directly returned through municipal and provincial allocations, with the remainder redistributed to fund national functions and other provinces. The R84 billion aligns with the WC’s official 2024/25 budget, as announced by the Western Cape Government, ensuring the province can meet its local priorities.

Provincial Expenditure: Prioritizing Wellbeing and Growth
The WC’s R84 billion provincial budget is allocated across four key priorities, reflecting its commitment to social and economic development:
- Wellbeing (R61.45 billion, 73%): The lion’s share funds health, education, and social services, supporting hospitals, schools, and community programs critical to the province’s 7.44 million residents.
- Economic Growth and Jobs (R15.25 billion, 18%): Investments in infrastructure, tourism, and job creation bolster the WC’s economic engine, particularly in Cape Town.
- Safety (R1.7 billion, 2%): This supports provincial safety initiatives, complementing national policing efforts.
- Innovation, Culture, and Governance (R5.6 billion, 7%): Funding for digital transformation, cultural programs, and administrative efficiency ensures responsive governance.
These allocations, drawn from the WC’s 2024/25 Budget Overview, demonstrate a balanced approach to addressing immediate needs while fostering long-term growth.
National Functions in the Western Cape: A Significant Presence
Beyond provincial spending, the national government spends R132 billion on functions within the WC, funded through the national fiscus and not the provincial budget. This expenditure, equivalent to 44% of the WC’s R300 billion tax contribution, covers services managed by national departments but delivered in the province. The breakdown, estimated using population (12% of 62 million), crime statistics, and economic significance, includes:
- Policing (R22 billion): The South African Police Service (SAPS) allocates R22 billion, reflecting the WC’s high crime burden (17.5% of national contact crimes, per Stats SA 2022/23 Crime Stats), despite a national budget of R112 billion.
- Social Grants (Payouts) (R30 billion): The WC’s share of the R266 billion national social grants budget, administered by SASSA, supports pensions, child support, and disability grants for residents.
- Health (National) (R20 billion): National hospitals (e.g., Groote Schuur) and programs like NHI pilots, part of the R254 billion national health budget.
- Education (National) (R15 billion): Higher education institutions (e.g., UCT, Stellenbosch), funded from the R135 billion national higher education budget.
- Public Works (incl. Electricity Infrastructure) (R15 billion): Includes R1.6 billion for parliamentary buildings and R13.4 billion for infrastructure, with ~R5 billion for electricity grid upgrades and Koeberg nuclear plant support, drawn from the R208 billion national infrastructure pool.
- Transport and Ports (R15 billion): Cape Town’s port and highways (N1/N2), part of the R78 billion national transport budget.
- Defense (R6 billion): Naval bases (e.g., Simon’s Town), a 12.5% share of the R48 billion SANDF budget.
- Justice and Correctional (R6 billion): Courts and prisons (e.g., Pollsmoor), from the R73 billion national budget.
- Immigration (R1.5 billion): Immigration services, a 15% share of the R10 billion Home Affairs budget.
- Social Development (Admin) (R1.5 billion): SASSA administrative costs, from the R8 billion national admin budget.
- Other National Functions (R3 billion): Miscellaneous departments (e.g., SARS, Environmental Affairs), a contingency for smaller national activities.
These figures are estimates, as South Africa’s national budget isn’t provincially disaggregated. Allocations were calculated using WC’s population share, adjusted for factors like crime rates (for policing), port activity (for transport), and parliamentary presence (for public works).
Contribution to Other Provinces: A Redistribution Role
The remaining R84 billion (28% of the R300 billion tax contribution) is redistributed to other provinces through the national fiscus, supporting poorer regions like the Eastern Cape and Limpopo. This reflects South Africa’s equitable share formula, which prioritizes need-based redistribution. The WC, as a wealthier province, effectively subsidizes less economically robust areas, a point often highlighted in Cape Independence debates.
The Balance Sheet: A Snapshot of Fiscal Flows
The WC’s 2024/25 balance sheet, below, summarizes these dynamics:
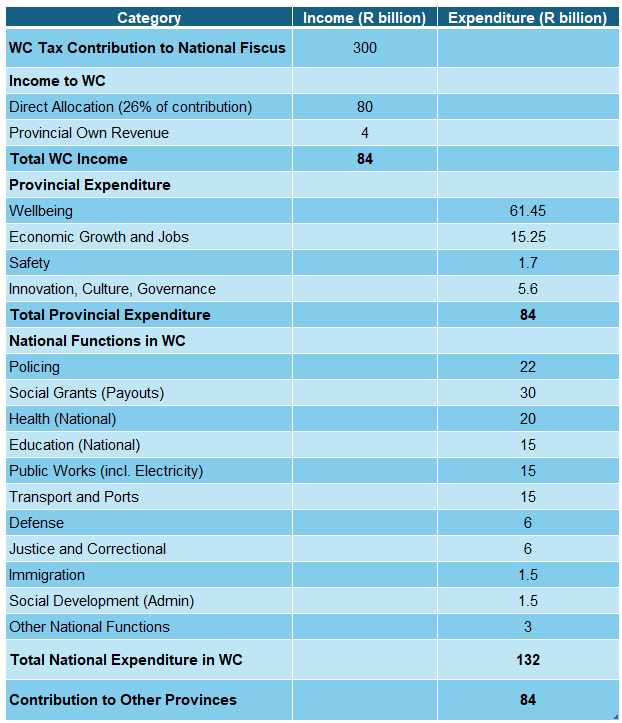
This structure assumes the WC receives 25% of its tax contribution back as its budget, 44% funds national activities within the province, and 28% supports other provinces, a framework grounded in fiscal redistribution principles and verified against the WC’s official budget.
Debt Repayment: The Cost of Independence
The prospect of WC independence, as advocated by movements like Cape Independence, raises questions about managing a proportional share of South Africa’s national debt. As of mid-2025, South Africa’s gross national debt is projected at R5.5 trillion (US$301.9 billion), per the National Treasury’s Medium-Term Budget Policy Statement (October 2024) and corroborated by X posts citing R5.857 trillion in 2024. With the WC’s population of 7.44 million representing 12% of South Africa’s 62 million, an independent WC would inherit R660 billion (US$36.22 billion) in debt.
Financing Costs:
South Africa’s debt service costs for 2024/25 are R385.9 billion on R5.2 trillion, implying a 7.4% effective interest rate. For WC’s R660 billion, at a slightly higher 7.6% rate (reflecting new sovereign risk), annual interest payments would be R50 billion.
If rates rise to 8–10% (plausible for a new nation), costs could reach R52.8–R66 billion annually.
Repayment Costs:
Assuming a 15-year repayment term, the principal repayment is R660 billion / 15 = R44 billion/year, plus R50 billion interest, totaling R94 billion/year.
A 30-year term reduces principal to R22 billion/year, for a total of R72 billion/year.
Alternatively, WC could roll over debt by issuing new bonds, paying only interest (R50 billion/year) but extending the debt indefinitely, mirroring South Africa’s current strategy.
Fiscal Impact:
In an independent WC scenario, the province would retain its R300 billion tax revenue plus R4 billion own revenue, totaling R304 billion. Current expenditures, adjusted for independence, are estimated at R226 billion (R84 billion provincial + R142 billion for national functions, including R1.5 billion for immigration, per recent Cape Independence discussions on X). Adding R50 billion in interest payments raises total expenditure to R276 billion, leaving a R28 billion surplus. Including principal repayments (R22–R44 billion) could erase this surplus or create a deficit, necessitating tax increases, spending cuts, or economic growth.
Challenges:
WC’s debt-to-GDP ratio (R660 billion / R977 billion = 67%) is high but manageable with fiscal discipline, unlike South Africa’s 75.5%.
A new credit rating could increase borrowing costs, and R198 billion in external debt (30% of R660 billion) exposes WC to exchange rate risks.
Negotiations might reduce the debt share (e.g., based on economic contribution), but the population-based approach is a standard starting point.
Conclusion
The Western Cape’s 2024/25 balance sheet illustrates its dual role as a major contributor to South Africa’s fiscus and a steward of local priorities. With R84 billion in provincial spending, R132 billion in national functions, and R84 billion redistributed to other provinces, the WC’s fiscal framework is robust yet constrained by national obligations. Independence could unlock the full R300 billion tax base, but inheriting R660 billion in debt would impose significant costs—R50 billion annually in interest alone, potentially R72–R94 billion with principal repayments. While a R28 billion surplus offers some buffer, long-term debt management would require strategic planning to ensure the WC’s economic promise is not overshadowed by inherited liabilities.
Sources
- National Treasury of South Africa (2024 Budget Speech, Medium-Term Budget Policy Statement October 2024): National revenue (R2.3 trillion), debt (R5.2–R5.5 trillion), debt service costs (R385.9 billion), and departmental budgets (e.g., SAPS R112 billion, Health R254 billion).
- Western Cape Government (2024/25 Budget Overview): Provincial budget (R84 billion) and expenditure priorities (Wellbeing R61.45 billion, etc.).
- Stats SA (2023 Mid-Year Population Estimates, Crime Stats 2022/23, GDP Data): WC population (7.44 million), crime share (17.5% contact crimes), GDP contribution (13.5–14% of R7.1 trillion).
- X Posts (September 2024): National debt estimates (R5.857 trillion) and Cape Independence discussions (immigration policies).
- CEIC Data, Statista (2024): Debt figures (US$310.9–US$321.3 billion) and projections.
- Transnet, SAPS Annual Reports: Port activity (20% container traffic), police stations (151 in WC), and personnel estimates.
