
WESTERN CAPE FISCAL AUTONOMY MODEL
Produced by the Cape Independence Advocacy Group, October 2026
(Download a pdf copy here - links to appendices at the bottom)
Executive Summary
The Western Cape Fiscal Autonomy Model models the consequences of full fiscal autonomy for the Western Cape, across four distinct modelling scenarios, over a ten-year period. Notably, none of these scenarios are sovereign independence — they relate to the Western Cape exercising fiscal autonomy within the South African State.
This matters because South Africa's own fiscal data reveals a persistent and widening gap between what the Western Cape contributes to the national fiscus and what it receives back in return — the subject of the Introduction below. Fiscal autonomy is the province's most direct available remedy.
The primary assumption of the model is that, in the absence of any specific change, the observed empirical outcomes of the last ten years are the best available predictor of what will happen in the next ten years. This no change, business as usual scenario, is defined as the Status Quo. Thereafter, the model progressively introduces two specific changes (ceteris paribus - everything else remains the same).
The first change is fiscal autonomy itself. As opposed to the South African State controlling the Western Cape’s fiscal flows – revenue collection, debt management, and the allocation of funds to the province – the Western Cape assumes responsibility for its own fiscal affairs, retaining all the revenue raised in the province, funding all of the services provided in the province, including those currently funded by national government, and servicing its own share of the national debt. The Econometrix Western Cape Fiscal Flows Report (2026) establishes the historical quantum of these figures. The effects of fiscal autonomy alone are modelled in the Conservative scenario.
The second change the model investigates is economic reform— the Western Cape obtains control of economic policy in the province and uses that control to implement the economic policies that the Western Cape has historically voted for, but which South Africa has not implemented. The modelt hen applies a benchmarked growth premium, calculated by investigating how other states or regions performed relative to their peers for the first ten years after they implemented similar economic reforms. This growth premium is then factored into the model at its full value (4.0%) in the Benchmarked scenario, and at half its value (2.0%) in the Central scenario.
The results, which are provided in full in the results section below, are transformative.
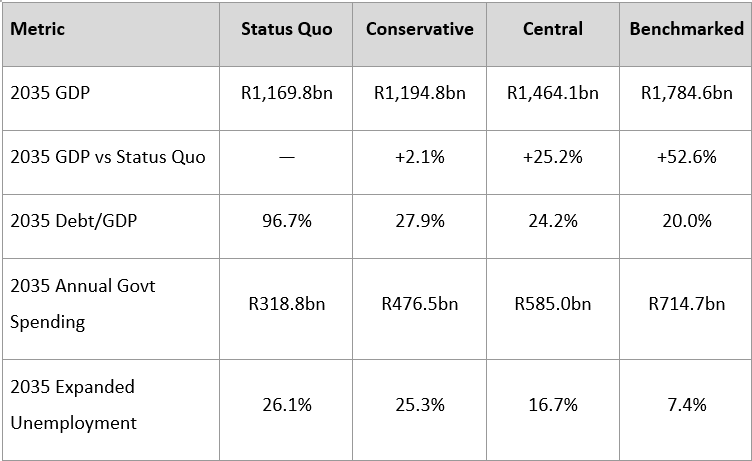
Under the Benchmarked scenario (fiscal autonomy plus full economic reform), within just ten years, relative to the Status Quo, the Western Cape would increase its GDP by over R0.6 Trillion (+53%), reduce its debt-to-GDP from 96.7% to 20.0%, increase government spending in the Western Cape by almost R0.4 Trillion (+124%), and reduce the expanded rate of unemployment to 7.4%.
Introduction
South Africa's government statistics indicate a long-term pattern of economic extraction through which the Western Cape subsidises then ational fiscus to the detriment of the province - acknowledging that somelevel of cross subsidisation is a consistent feature of most states.Specifically, the Western Cape historically achieves higher growth and lower unemployment,whilst producing a significantly higher GDP per capita than South Africa aswhole. It also contains a disproportionately high number of South African taxpayers.
Despite this, the Western Cape historically receives a disproportionately low share of the funds distributed to provinces under its Provincial Equitable Share (PES). In the period between 2015 and 2024, the Western Cape's contribution to South Africa's GDP rose from 14.1% to 14.2%, its contribution to South Africa's total personal income tax (PIT) revenue rose from 16.4% to 18.4%, whilst the share of the South African population it houses rose from 11.6% to 12.0%. In stark contrast, its PES rose from just 10.0% in 2015 to 10.3% in 2024 — far below the level of its fiscal contribution and population.
This situation takes on a political dimension when election results are juxtaposed against this data. The Western Cape is the only province where the majority of voters have habitually voted against the national government and its policies. As a result, the Western Cape is disproportionately subsidising a programme of government which it has politically rejected.
In November 2026, a Western Cape Fiscal Flows Report, produced by Econometrix, an established and respected economic research company, was jointly released by the Cape Independence Advocacy Group (CIAG) and Lex Libertas (LL). For the first time, the report quantified the revenue being raised by the South African Government in the Western Cape, and the corresponding quantum of funds being spent by the State on the Western Cape. It revealed a large and increasing fiscal outflow, whilst a reducing share of the revenue raised in the province was returned to it as spending.
This Western Cape Fiscal Autonomy Model (v4.0) has been created by the CIAG to build upon the Econometrix findings and to model the likely effects, over the initial ten-year period, of the Western Cape achieving full fiscal autonomy.
The model examines two distinct aspects of fiscal autonomy. The first is fiscal isolation from South Africa. It assumes that all the revenues raised, the quantum of which has been established in the Econometrix report, remain within the Western Cape and fiscal extraction by South Africa comes to an end. The second is establishing control over economic policy, whereafter the Western Cape broadly pursues the economic policies it has historically voted for as opposed to, as at present, the economic policies of the South African national government which the Western Cape has historically voted against.
Model Scenarios
The model contains four distinct scenarios:
Status Quo models the likely outcome in ten years' time should there be no change in the Western Cape's constitutional arrangements, no fiscal autonomy, no control over economic policy, and where the performance of the next ten years is a continuation of the last ten years.
Conservative models the likely outcome in ten years' time should the Western Cape obtain fiscal autonomy and fiscal flows cease —the Western Cape retains all revenue raised within the province, fiscal extraction ends, and the Western Cape assumes direct responsibility for servicing its proportional share of South Africa's national debt. National government retains control of economic policy, and — other than the retention of its fiscal surplus — the Western Cape's economic performance over the next ten years remains a continuation of the last ten years.
Central models the likely outcome in ten years' time should the Western Cape secure fiscal autonomy, ending fiscal flows to South Africa, and obtain control of economic policy. As a result, economic performance no longer directly tracks the previous ten years but instead benefits from a 2.0% growth premium. This premium is calculated by observing the growth premium historically achieved by comparable economies who undertook similar economic reforms and pursued economic policies broadly aligned with those which the Western Cape has historically voted for. In the central scenario, this comparable growth premium, which is 4.0%, is discounted by 50% to provide an intentionally conservative outcome.
Benchmarked models the likely outcome in ten years' time should the Western Cape obtain fiscal autonomy and control of economic policy. In this scenario, the full 4.0% growth premium is applied.
None of the four scenarios is a forecast: each shows the direction of travel and the order of magnitude of outcomes under its stated assumptions.
Methodology
Data Sources: The model is built from primary data sources throughout. No assumption has been made where observed data was available, and where assumptions were necessary, they have been made conservatively and are explicitly documented. All rand values are expressed inconstant 2025 prices, using South Africa's GDP deflator, consistent with the Econometrix Western Cape Fiscal Flows Report. The first modelled year, labelled 2025, is observed 2024 data expressed in 2025 prices. Full assumptions, methodology, and sources are documented in Appendices A, B and C respectively.
Fiscal Capture Rates: The model uses two distinct fiscal capture rates — the proportion of GDP that becomes government revenue.
For South Africa's national fiscal position (the SA Baseline), South Africa's consolidated government revenue as a percentage of GDP is used, which averages 27% over the preceding decade (National Treasury Budget Reviews 2015–2024).
For the Western Cape, in the Status Quo and all three autonomy scenarios, the Western Cape's own observed fiscal capture rate of 40.5% is applied, held constant for ten years. It is taken from Econometrix's 2024/25 reconciliation of the Western Cape's fiscal position: R421.55 billion of revenue raised against WC GDP of R1,041 billion (Stats SA, 2024). It includes provincial and municipal self-raised revenue, including municipal service charges, so it is not a tax-to-GDP ratio. On a like-for-like basis, national taxes attributed to the Western Cape amount to about 30.6% of its GDP, against South Africa's tax-to-GDP ratio of 25.1%; including municipal property rates, the Western Cape's tax take is roughly 32–33% of GDP, close to the OECD average of 33.9%.
The Western Cape's higher rate reflects its structural economic characteristics: a larger formal economy, higher average incomes, and a greater concentration of taxable economic activity. South Africa's lower national average reflects the broader informal economy, higher unemployment, and lower rates of government revenue collection.
Interest on debt: All scenarios apply an effective interest rate of 2.2% (real) to the opening debt balance in each year. This is derived from National Treasury's projected nominal effective interest rate onS outh Africa's gross loan debt (7.1%, Budget Review 2026), converted to a real rate using South Africa's GDP deflator (by deducting the deflator's average annual rise of 4.9% over 2015–2025, Stats SA), consistent with this model's constant-price basis throughout. Under the three autonomy scenarios, interest is charged on the opening balance before any allocation of retained revenue, representing a mandatory prior obligation. Under the Status Quo, interest is calculated as a diagnostic figure only: the modelled national deficit already reflects total government expenditure inclusive of debt-service costs, so it is not added to the debt stock a second time.
Multiplier Effect: The model applies a fiscal spending multiplier of 0.16 to the additional government spending generated under each autonomy scenario — the increment above Status Quo spending in each year. This multiplier is derived from a UNU-WIDER working paper on South African fiscal policy (Du Rand, Hollander and van Lill, 2023, WIDER Working Paper 2023/106, UNU-WIDER), which estimates the government consumption multiplier for South Africa at 0.16 — the paper's own average cumulative estimate of 0.155 is reported as not statistically different from zero over the full 1994–2019 sample. The multiplier is applied with a one-year lag, consistent with the same study's finding that the peak multiplier effect occurs four quarters after a spending shock. The multiplier is applied as a level effect on consumption (services) spending only: each year's additional spending lifts the following year's GDP once, and the lift lasts only as long as the additional spending continues. Infrastructure and capital spending are not modelled.
It must be noted that the study from which the multiplier is derived is contextually different from the Western Cape scenario, and as such must be viewed as the best available data as opposed to ideal. The model assumes that a large on-going increase in provincial spending, funded directly by additional revenue rather than debt, will provide some level of economic impetus. The direction of any bias is uncertain: leakage to the rest of the country would lower a provincial multiplier, while retaining revenue that previously left the province could raise it. Without any multiplier, the 2035GDP gains over the Status Quo would be about 0%, +21.7% and +47.6%, compared to+2.1%, +25.2% and +52.6% with it.
Unemployment: Unemployment projections are derived from the Wesgro employment elasticity of 0.52, which measures the relationship between economic growth and employment in the Western Cape (Wesgro, 2024). The elasticity is converted into a year-on-year change in the unemployment rate and is applied to the actual growth rate achieved in each scenario above the 0.8% baseline, including growth generated through the fiscal multiplier effect. The elasticity is derived from observed Western Cape data over the period 2015-2024 and implicitly incorporates historical labour force dynamics including participation rate changes, net migration and demographic shifts, on a ceteris paribus basis. A frictional unemployment floor of 5.0% is applied, consistent with the IMF's general concept of a natural rate of unemployment. Because the formula does not allow new jobs to draw additional people into the labour force, it likely overstates the fall in unemployment, most noticeably in the Benchmarked scenario. No scenario reaches the floor by 2035.
Limitations: The model does not attempt to model transition costs, institutional design, currency arrangements, capital flows, infrastructure spending, or the legal and constitutional pathway by which fiscal autonomy might be achieved. These are material considerations that fall outside the scope of this model. Status Quo extraction is projected broadly flat in relation to the economy, and is therefore a floor, not a forecast of the historical deterioration.
2.1 Status Quo Methodology
The Status Quo scenario models the Western Cape's position, under South Africa's existing fiscal arrangements, where the Western Cape's position is proportionally derived from South Africa's position. The Western Cape has no fiscal autonomy under this scenario — it does not control how revenue raised in the province is collected, allocated or spent.
The starting point is South Africa's consolidated fiscal position, expressed as percentages of GDP derived from National Treasury Budget Reviews over the preceding decade: revenue of 27% of GDP, debt servicing of 4.0% of GDP, programme spending of 27.3% of GDP, and a budget deficit of 4.3% of GDP. These ratios are applied to South Africa's GDP, which grows at 0.7% per annum in real terms — South Africa's observed ten-year real GDP compound annual growth rate (Stats SA, P0441, 2024). South Africa's debt grows each year by the amount of the modelled deficit.
This 4.3% figure is a ten-year average of South Africa's own annual, current-price deficit ratios (National Treasury Budget Reviews,2015–2024), held constant rather than consolidated. This is a deliberate modelling choice, not an oversight: National Treasury's own published medium-term stabilisation targets have a consistent recent history of being missed and revised upward — in each of the most recent Budget cycles examined, a stated stabilisation point was pushed later and higher within one to two years, without exception. On that basis, realised historical fiscal behaviour is treated here as a more reliable basis for a ten-year projection than Treasury's stated intentions. "Status Quo" therefore means a continuation of business-as-usual fiscal behaviour, not a reproduction of Treasury's current stated policy path.
The Western Cape's position is derived as follows. Revenue raised in the province is calculated by applying the WC fiscal capture rate of 40.5% to WC GDP, which grows at 0.8% per annum — the WC's observed ten-year real GDP compound annual growth rate (Stats SA, P0441.2, 2024). The Western Cape does not retain this revenue under the Status Quo; it flows to the national fiscus. Spending received is set from Econometrix's 2024/25 reconciliation — about R297 billion in 2025 prices (68% of revenue raised) —growing in line with South Africa's programme spending trajectory. Debt servicing (a diagnostic figure used to calculate net extraction, not added to the province's debt stock a second time) is calculated as 12% of South Africa's modelled annual interest bill — the Western Cape's proportional population share of the national debt obligation. Additional debt accumulation is calculated as 12% of South Africa's annual deficit.
The gap between revenue raised and spending received is defined by the model as fiscal extraction — the net outflow from the Western Cape to the national fiscus each year. This figure emerges as a model output rather than an input. In 2025, the model produces a total extraction of about R140 billion, matching Econometrix's 2024/25 headline figure.
Unemployment under the Status Quo is projected using the observed ten-year trend in Western Cape expanded unemployment, derived from Stats SA Quarterly Labour Force Survey data (Q1 2015: 23.3%; Q1 2025: 24.7%).This implies an average annual worsening of 0.14 percentage points, which is applied consistently across the modelling period. Between 2015 and 2024, the Western Cape's population grew by approximately 2.1% per annum outpacing GDP growth of 0.8% per annum.
2.2 Conservative Methodology
The Conservative scenario assumes that the Western Cape achieves full fiscal autonomy but that economic policy and its associated growth rates remain unchanged from the Status Quo trajectory. GDP continues to grow at 0.8% per annum. This scenario is designed to isolate the fiscal effect of autonomy — changes which result purely from the retention of revenue, independent of any changes in economic policy.
Under fiscal autonomy, the Western Cape retains all revenue raised within it, calculated at 40.5% of GDP. Fiscal extraction ceases. The Western Cape assumes full responsibility for its inherited debt of R684 billion and services it directly.
Revenue is allocated as follows. Interest on the opening debt balance is charged first at 2.2% — this is a mandatory prior obligation. The remaining revenue is then split: 25% is allocated to principal debt reduction and 75% to government services. This rule applies until provincial debt falls to 30% of GDP, at which point all remaining revenue after interest is allocated entirely to services. The 30% debt-to-GDP threshold functions thereafter as a ceiling, not a maintained level. Because interest is paid in cash and no further principal repayment occurs once the threshold is reached, the debt balance itself stops moving — it is not being actively held stable. The debt-to-GDP ratio continues to fall in the results because the 30% threshold itself keeps rising with GDP, not because the debt is shrinking further.
The unemployment projection under the Conservative scenario reflects both the baseline deterioration trend of 0.14 percentage points per annum and the additional employment benefit generated by the fiscal multiplier. Under the Conservative scenario, the significant increase in government spending above the Status Quo generates additional economic activity through the multiplier effect, which in turn produces modest but measurable employment improvement. No explicit growth premium is assumed — the employment benefit arises solely from increased government spending under fiscal autonomy.
2.3 Central Methodology
The Central scenario applies the same fiscal autonomy framework as the Conservative scenario. The only difference is the application of a growth premium of 2.0% per annum above the Status Quo trajectory, producing a combined real growth rate of 2.8% per annum in underlying growth, before the multiplier's level effect (an average of about 3.1% a year including it).
This premium is derived from the observed post-reform growth experience of four comparable small open economies — Estonia, Ireland, Mauritius and Botswana — each of which pursued significant structural economic reform and achieved sustained growth acceleration. The full comparator premium is 4.0% per annum. In the Central scenario this premium is discounted by 50% to produce an intentionally conservative outcome that reflects partial rather than full policy reform success. The full derivation of the comparator premium, including caveats specific to the Estonia and Ireland comparators, is documented in Appendix D.
The additional economic growth generates additional government revenue through the fiscal capture mechanism. This additional revenue accelerates debt reduction and increases government spending capacity above the Conservative scenario. The compounding nature of GDP growth means that outcomes diverge materially between scenarios over the modelling horizon.
The unemployment projection applies the Wesgro employment elasticity of 0.52 to the actual growth rate achieved in each year above the 0.8% baseline. This actual growth rate incorporates both the 2.0% explicit growth premium and the additional GDP generated through the fiscal multiplier effect on increased government spending. The elasticity is derived from observed Western Cape data and implicitly incorporates historical labour force dynamics including participation rate changes, net migration and demographic shifts, on a ceteris paribus basis (Wesgro, 2024). The status quo's underlying 0.14 percentage point annual increase continues to apply alongside these changes (see Section 2.1).
2.4 Benchmarked Methodology
The Benchmarked scenario applies the same fiscal autonomy framework as the Conservative and Central scenarios. The full comparator-derived growth premium of 4.0% per annum is applied, producing a combined real growth rate of 4.8% per annum in underlying growth (an average of about 5.1% a year including the multiplier's level effect). No discount is applied.
The Wesgro employment elasticity of 0.52 is applied to the full 4.0% growth premium plus the additional GDP generated through the fiscal multiplier, producing the maximum employment benefit of the four scenarios. The status quo’s underlying 0.14 percentage point annual increase continues to apply.
The Benchmarked scenario is not presented as a forecast or a target. It is presented as a quantified benchmark — a precise answer to the question of what becomes possible if the Western Cape replicates the reform trajectory of its comparator economies.
Section 3 —Results
The results are presented for each scenario in turn. All figures are expressed in constant 2025 prices. The headline results across all four scenarios are summarised in the table below.
3.1 Status Quo Results
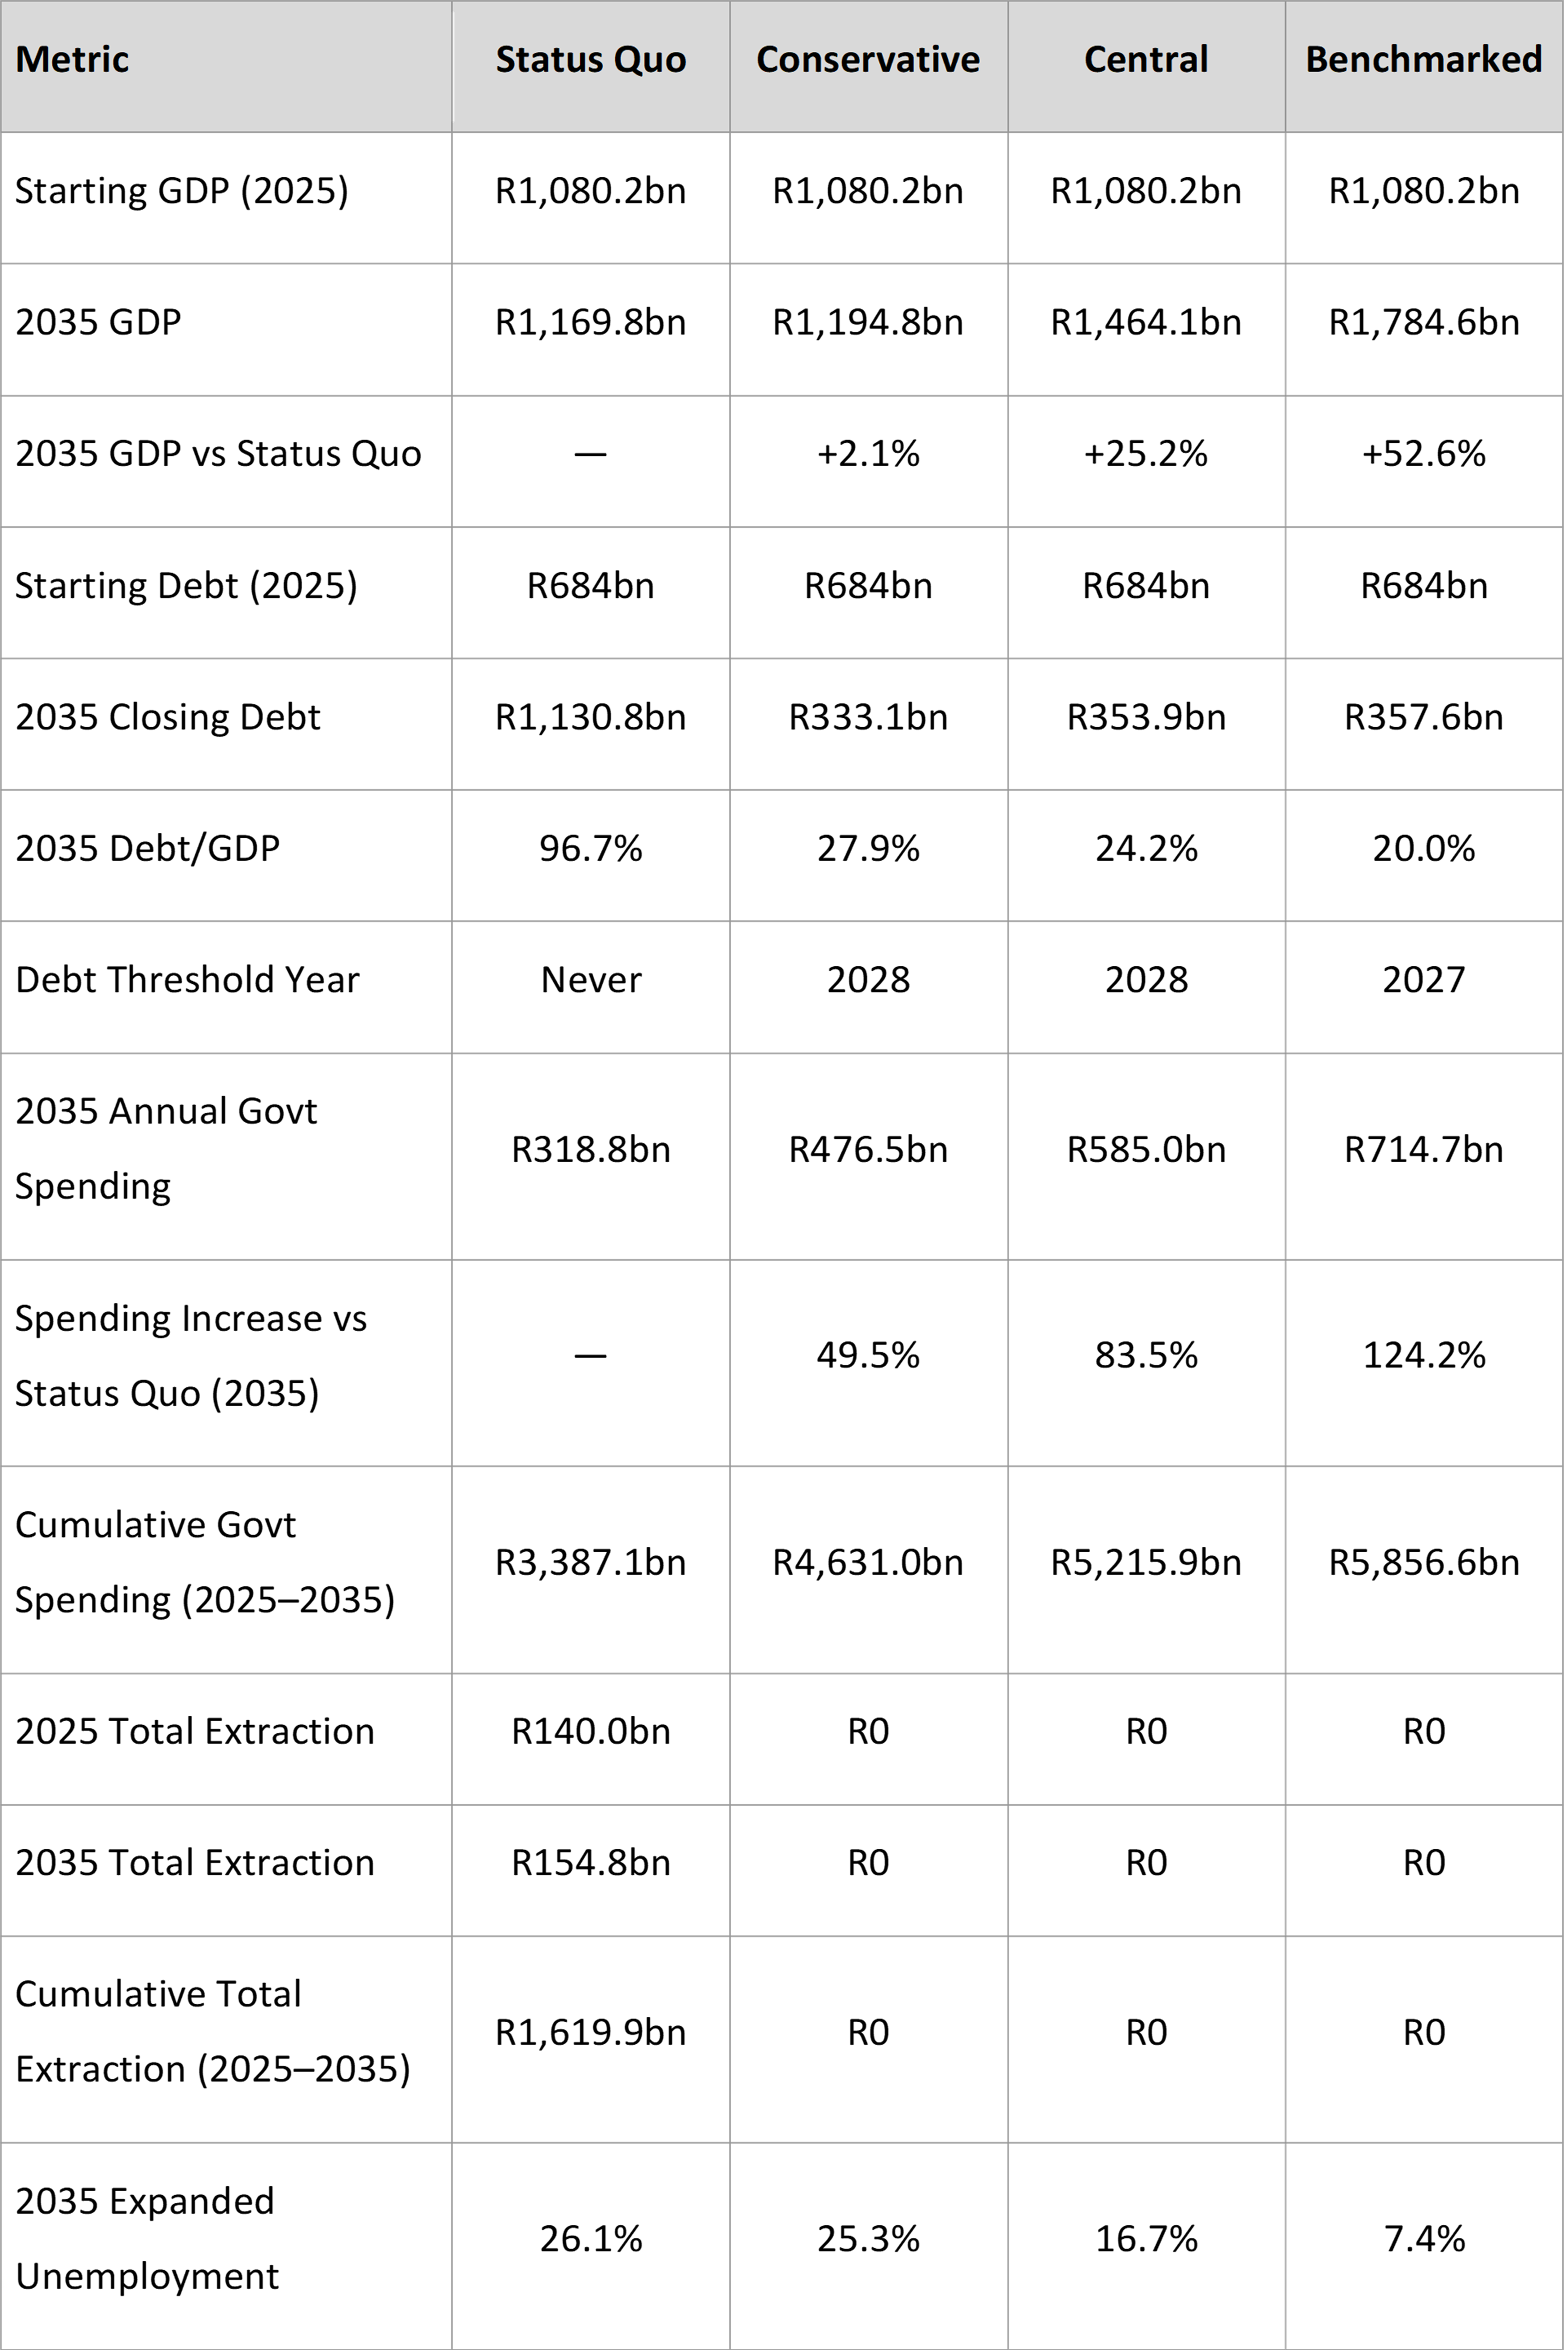
Under the Status Quo, South Africa's fiscal trajectory continues unchanged. National debt grows from R5.7 trillion in 2025 to R9.4 trillion by 2035, driven by a structural budget deficit averaging 4.3% of GDP, held constant with no fiscal consolidation. South Africa's debt-to-GDP ratio rises from approximately 75% to approximately 116% over the modelling period.
The Western Cape's position deteriorates in tandem. The province's inherited share of national debt grows from R684 billion to R1.13 trillion by 2035, with a debt-to-GDP ratio rising from 63.3% to 96.7%. This occurs despite the Western Cape generating a substantial fiscal surplus throughout the period.
Fiscal extraction — the net outflow of revenue raised in the Western Cape that is not returned as government spending — stands at R140billion in 2025 and grows to R154.8 billion by 2035. Over the full modelling period, cumulative total extraction amounts to R1.62 trillion. Net extraction —the amount above and beyond the Western Cape's legitimate debt obligation —rises from R125.2 billion in 2025 to R131.3 billion by 2035: because the Western Cape's own debt-servicing obligation is modest relative to the revenue it generates, the great majority of total extraction represents discretionary outflow rather than debt-related cost.
Government spending received by the Western Cape grows modestly from R297.3 billion in 2025 to R318.8 billion by 2035 — an increase of 7.2% over ten years, or less than 0.7% per annum in real terms.
Expanded unemployment worsens from 24.7% in 2025 to 26.1% by 2035, consistent with the observed ten-year trend.
The Status Quo presents two compounding deteriorations simultaneously: the Western Cape pays more in extraction each year, whilst receiving a declining share of the revenue it generates returned as government services. This deterioration is a floor, not a forecast: the Econometrix report records the Western Cape's net fiscal contribution roughly doubling between2015 and 2024, from about R70 billion to about R140 billion, and the model deliberately does not extrapolate that trend.
3.2 Conservative Results
Under the Conservative scenario, fiscal autonomy is achieved and all extraction ceases immediately. The Western Cape retains all the revenue it generates, calculated at 40.5% of GDP. Inherited debt of R684 billion is serviced directly by the province.
Government spending increases immediately from the first year of autonomy. Spending of R316.9 billion in 2025 — already above the Status Quo's R297.3 billion — grows steadily as debt is reduced and more revenue becomes available for services. The model's 30% debt-to-GDP threshold is reached in 2028, at which point only the interest is serviced, with the full remainder of revenue available for services. By 2035, annual government spending in the Western Cape reaches R476.5billion — 49.5% above the Status Quo equivalent.
Debt falls from R684 billion to R333.1 billion by 2035, equivalent to 27.9% of GDP. This represents a reduction of R350.9 billion from the initial level of debt, achieved without any change in economic growth rates and purely through the retention and disciplined allocation of revenue that currently leaves the province.
The fiscal multiplier on increased government spending lifts the level of GDP by about 2% by 2035. Applied through the Wesgro employment elasticity, this produces a small improvement in employment outcomes. Expanded unemployment falls from 24.7% in 2025 to 25.3% by 2035, compared to 26.1% under the Status Quo — an improvement of 0.8 percentage points, achieved without any explicit economic reform.
Cumulative government spending in the Western Cape over the modelling period is R4,631.0 billion, compared to R3,387.1 billion under the Status Quo — an increase of R1,243.8 billion over ten years.
3.3 Central Results
The Central scenario adds a 2.0% growth premium to the Conservative fiscal framework, producing a combined real growth rate of 2.8% per annum. This premium represents partial success in implementing the economic policies that the Western Cape has historically voted for, benchmarked at 50% of the full comparator premium.
Higher GDP growth generates additional revenue through the 40.5% fiscal capture rate. This additional revenue accelerates debt reduction, allowing the model's 30% debt ceiling to be reached in 2028, and significantly increases government spending capacity throughout the period. The fiscal multiplier on the larger spending differential above Status Quo adds a further, non-compounding lift to the level of GDP.
By 2035, annual government spending in the Western Cape reaches R585.0 billion — 83.5% above the Status Quo equivalent. GDP reaches R1,464.1 billion, compared to R1,169.8 billion under the Status Quo. Debt falls to 24.2% of GDP by 2035, equivalent to R353.9 billion — well below the model’s30% ceiling.
Expanded unemployment falls from 24.7% in 2025 to 16.7% by 2035, driven by the combination of the 2.0% growth premium and the multiplier effect on increased spending. This compares to 26.1% under the Status Quo — a differential of 9.4 percentage points.
Cumulative government spending in the Western Cape over the modelling period is R5,215.9 billion — R1,828.7 billion more than the Status Quo over ten years.
3.4 Benchmarked Results
The Benchmarked scenario applies the full 4.0% comparator growth premium, producing a combined real growth rate of 4.8% per annum. This represents the outcome of the Western Cape replicating the aggregated reform trajectory of Estonia, Ireland, Mauritius and Botswana following their periods of structural reform.
The higher growth rate generates substantially more revenue, accelerates debt reduction to the 30% threshold by 2027, and produces a significantly larger spending differential above Status Quo. The fiscal multiplier on this larger differential adds a further, non-compounding lift to the level of GDP. GDP reaches R1,784.6 billion by 2035 — 52.6% above the Status Quo outcome.
Annual government spending in the Western Cape reaches R714.7 billion by 2035 — 124.2% above the Status Quo equivalent. Cumulative spending over the modelling period is R5,856.6 billion — R2,469.4 billion more than the Status Quo over ten years. Debt falls to 20.0% of GDP by 2035,equivalent to R357.6 billion — the largest undershoot of the 30% ceiling among the three autonomy scenarios.
Expanded unemployment falls from 24.7% in 2025 to 7.4% by2035, 18.7 percentage points below the Status Quo. This is the model's formula applied to a sustained growth premium, not a labour-market forecast.
Section 4 — Principal Conclusions
The Status Quo is not sustainable: The model projects that South Africa’s national debt will continue to rise at well over R300bn per annum, growing by approximately 65% during the modelling window, continuing a trend established over the previous two decades.
Under the Status Quo, the Western Cape does not chart its own course — its fate is directly tied to South Africa's economic performance. Despite running an extremely large fiscal surplus, it will continue to absorb an increasing share of a debt it did not create, losing more of its revenue each year to extraction, and receiving a declining share of that revenue back in services.
Objectively, it would be hard to argue that the current arrangements are in the best interests of the province.
Fiscal Autonomy fundamentally alters the Western Cape situation: Even under the Conservative scenario, the Western Cape’s debt is more than halved in just three years (by 2028) from R684 billion to R333 billion. Government spending over the modelling window is 36.7% higher than under the status quo, and annual spending is 49.5% higher by 2035. Unemployment improves only slightly (25.3% against 26.1%). This is because the model uses Wesgro’s employment elasticity factor, which is a function of economic growth, which autonomy alone delivers only in limited amounts.
These outcomes arise purely through the Western Cape retaining revenue it already generates.
Economic Reform is radically transformative: The addition of relatively modest and internationally uncontroversial changes in economic policy would radically improve the economic and social well-being of the Western Cape.
Even in the central scenario which intentionally discounts the historical effects of similar economic reform in comparative case studies, the Western Cape would increase spending on services by 83.5%, reduce unemployment to 16.7%, whilst reducing debt-to-GDP from 63.3% to 24.2%.
Applying the full comparative effects of similar economic reforms, as the benchmarked scenario does, fundamentally alters the character of the Western Cape economy, elevating its performance to a level almost unimaginable in present day South Africa.
In just ten years, GDP would increase to R1.8 trillion, 52.6% higher than the status quo, debt would fall to 20.0% of GDP whilst government spending rises to more than double the status quo (+124.2%), and the expanded rate of unemployment would fall to 7.4%. The collective impact of these numbers can only be described as profound – positive transformation, in the true sense of the word, which would benefit every sector of Western Cape society.
Appendicies
Appendix A - Assumptions Register
Appendix B - Calculations Register
Appendix D - Comparative Growth Model Methodology
WC Fiscal Autonomy Model - Worksheet
EM v4.0, Western Cape Fiscal Autonomy Model


